Today’s physics lesson was all about graphs, but not the basic “read the value from the axis” type. We studied the deeper, more advanced side of interpreting graphs in physics — the kind that appears in electricity, pressure, heat, and motion. What made this session challenging wasn’t the content itself, but the level of analysis required to solve problems accurately.
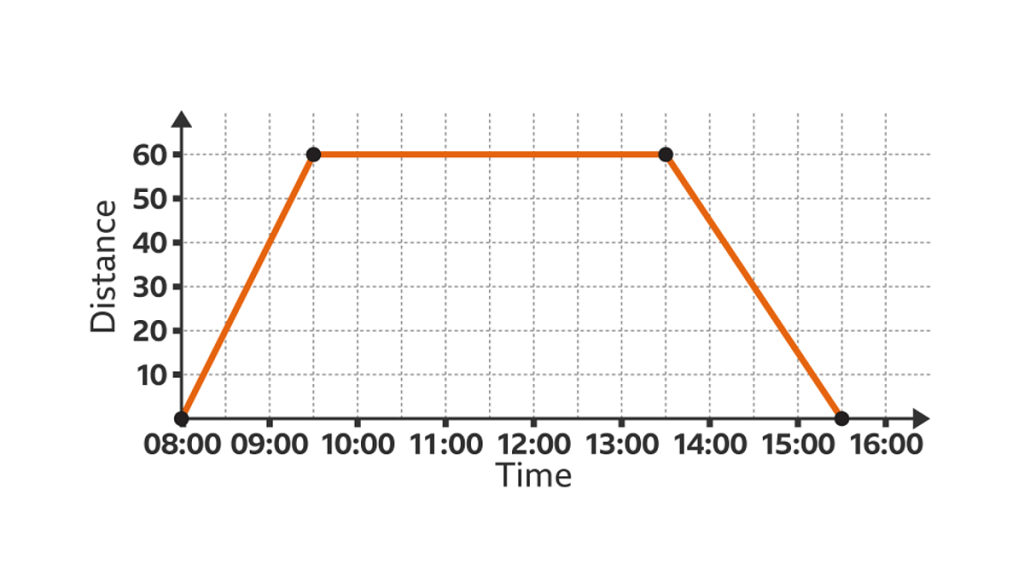
We started with speed–time and distance–time graphs, but instead of simple interpretations, we focused on how the shape of the graph reveals the exact behavior of an object. A straight line meant constant acceleration, a curve meant changing acceleration, and the area under the graph gave distance. The challenge came from unusual graphs: sudden jumps, piecewise curves, and sections that required integrating or comparing slopes carefully.
Next, we worked with pressure–volume graphs, especially in contexts like gases and fluids. Here, the relationships weren’t linear, so solving problems required understanding how curves behave. A slight change in the graph’s steepness could completely alter the relationship. Many questions asked for energy changes or work done, which meant analyzing areas under curves rather than relying on formulas alone.
Then came electricity graphs — current–time, voltage–time, and charge graphs. The key here was understanding that the graph’s gradient or area corresponded to physical quantities. Current–time graphs required integrating to find charge. Voltage–time graphs revealed potential differences that changed with time, especially in circuits involving components like capacitors. These problems required thinking in terms of relationships, not memorized rules.
We also studied heating and cooling curves, where the graph’s flat sections represented phase changes. Instead of simply identifying the plateau, we had to reason about energy input, latent heat, and specific heat capacity, linking the graph’s shape to the physical behavior happening at each temperature region.
Throughout the lesson, the biggest focus was on strategies rather than formulas. The teacher emphasized looking at three elements: the slope, the area under the curve, and the overall trend. Solving a graph problem meant translating a visual change into a physical explanation. Instead of just calculating, we had to justify why the graph looked the way it did and what that meant physically.
By the end of the session, I realized how powerful graphs really are in physics. They don’t just show numbers; they reveal the entire story of a physical process. Understanding how to read them deeply is one of the most important skills in the subject, and today’s advanced practice made that clearer than ever.

Leave a comment